High-speed movies at ignition stage
| Typical cleaning action at arc ignition stage | |||
|---|---|---|---|
 |
 |
 |
 |
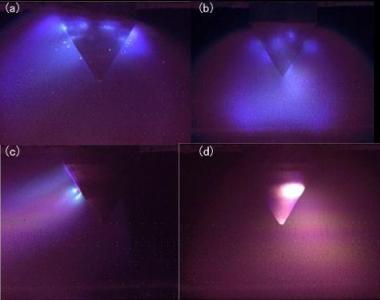
| 1)RIM growth | 2)Wet surface | 3)no arc | 4)molten flow |
Right movie was captured to prove melting situation. Left movie looks like axially symmetric. So, I thought this symmetry was caused by hitting of hot particles from plasma. So, I made less hot plasma condition by short-circuiting condition by aluminum plate between the cathode and the base metal. Whole range movie is difficult to observe melting condition. Enlarged movie of melting region is much easier to understand melting behavior. Liquid melting layer is grown to balloon by inner gas. It burst, finally.
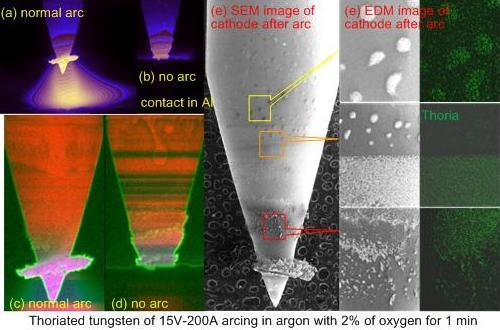 Molten thorium is clearly captured as EDM and SEM images. They are debris on the surface, and they are easy to melt. The work function of them are quite low compared to tungsten. Then they acts good breakdown material for next arc ignition.
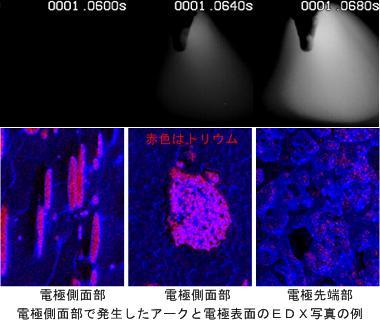 Right pictures show why sub-stable arc occurs on the side area of cathode surface. Almost all thoria at top region is almost exhausted as shown in image(e) at cathode top. Thoria is drawn as red small dots. Much material of this top area was already lost by evaporation, where was drawn in black.
On the contrary, there are thoria rich region on the cathode side surface as shown in image(c) and (d). This area works good cathode area to produce electron from this area to outside.
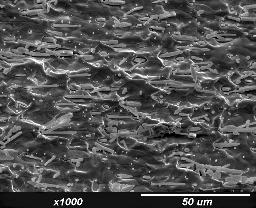
A SEM image on the side surface of a used electrode. Welding condition was 300A for 30min in argon shield. There are many tree like thoria are appeared on the surface. A left top map shows the area of this SEM image on the cathode. This area is the same location as image(b) of the former picture. These tree like material work as good initiator of next arc ignition.
 Temperature of a base electrode is low at the arc ignition stage. Heat capacity is also large compared to debris attached on the surface. Heat capacity of debris is much low. This is another reason why cleaning actions occur on debris. Right 4 pictures are good to understand these reasons. Melting and boiling reaction for these small debris are very strong, then plume jets spurted from the cathode surface flushes a vertical direction of the cathode. Capturing of high-speed video finishes quickly. However, watching captured video takes quite long time. One good way to understand the results of captured information quickly is statistical method 1s shown in right.
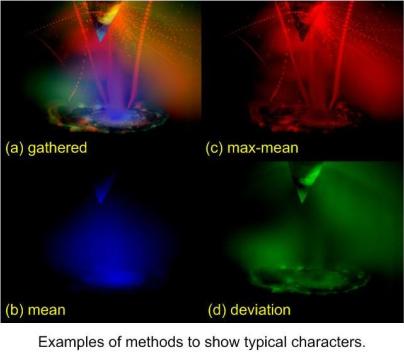
An image(a) is gathered typical information from all images into one image. Sometimes, it is enough to pick up maximum brightness of each pixel from all frames. An image(b) shows average brightness for all images. Average values are quite low for normal capturing condition. So, this image is normalized to improve image quality. An image(c) shows typical reactions of spatters and arc plasma. This image is created from the maximum values and minimum values of whole image for each pixels. An image(d) shows deviation on each pixels for all frames. This image is also normalized. The image(a) is a gathered image from images(b, c, d). The image(b), image(c) and image(d) are drawn by blue color, red and green, respectively. So, gathering three images are very easy. Understanding the whole process becomes very easy, while the meaning of color is known.
This processed image gives us a good understanding of what was happening in the short duration of arc ignition stage. Many particles are spattering from the cathode surface. This is one answer why erosion rates of arc ignition duration are relatively large and erosion rate of the cathode in helium shield is high. Some particles come from the base metal. These locus can be analyzed their number, emitting direction and velocity. High-speed video image contains very useful information, because of their bigness. For example, Two seconds image at video rate of 50kfps has 100,000 frames of digital data. Each video frame consists of 512x512 pixels of 12bits data. This means one high-speed video has almost 433Giga bytes of information on arc ignition. So, it is very important to analyze statistically. Detailed explanation is open in next page.
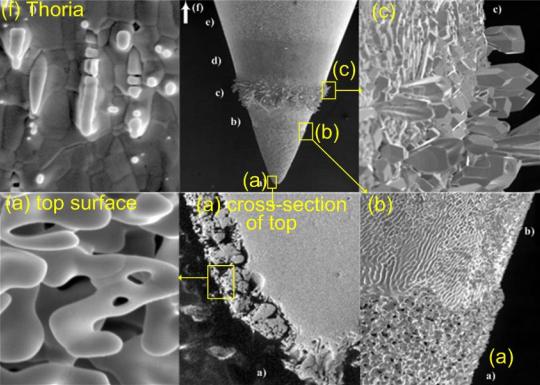
However, loses at the arc ignition stage are almost the same at around 3mg. Total weight of many debris on the surface are considered around 3mg. Right down pictures are SEM images of used electrode. There is only a minor damage by arc welding at a glance of (a)whole picture. However, (e) is a image at the top of the cathode. There are many gaps at the top. This top section is on of major lost area.
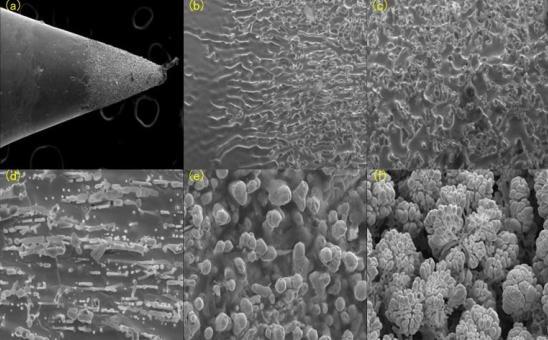
Another big lost area is (e)evaporating area of tungsten oxide. Apart form the cathode top, there is a region to produce thoia from the inside of the electrode to the surface as shown in (d). This part is a main lost area at arc ignition stage.
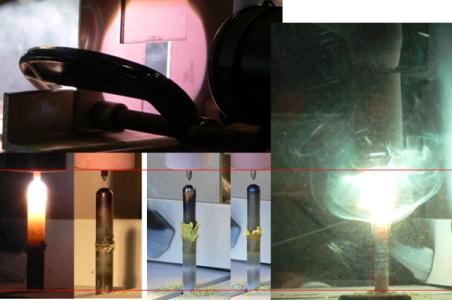
Right pictures show how thoria melts and boils in low temperature area. Anode has no effect to reduce temperature by electron emission. So, the temperature at the anode is much higher than the cathode. A left-bottom is a picture of a moment of arc expiration. The temperature near the top is quite high and its brightness is clear. However, the boiling area of thoria is much far from the hot region of the anode top.
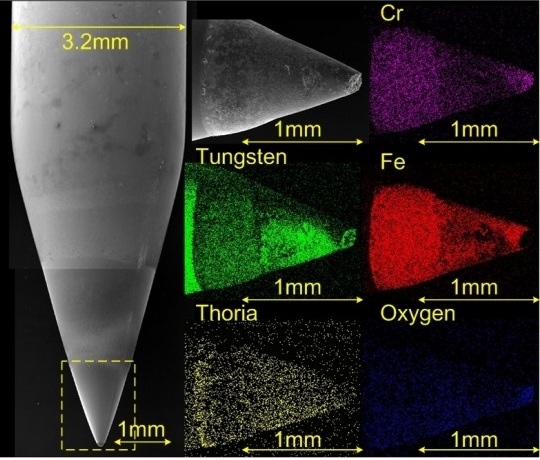 Right picture shows EDM images of the used cathode of only a few seconds arc duration. Iron vapor from the base metal can be seen on the cathode, in this case. Chromium from the base metal is also appeared.
Right below pictures shows RIM formation and lost of cathode material on top of the cathode.
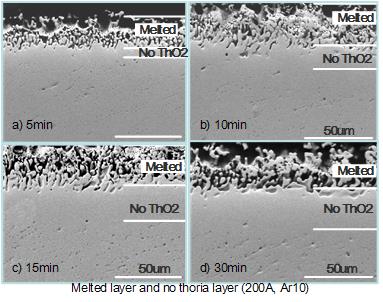
Some amount of cathode material on the top of the cathode is lost by arc time. Left figure shows time response of material loss at each arc time. Thoria is selectively evaporated. When the thoria is completely lost, remained tungsten part was melted.
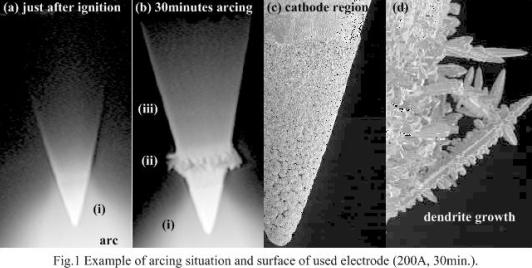
 Right picture is one example of typical surface for used cathodes. The surface is remarkably changed by heat during arc time. Some amount of the cathode top area is lost. And a region just above RIM formed area is also lost. These two lost region are the major area for material loss of steady arc time. On the contrary, there are many debris of dendrite crystal on areas above the cathode spot zone. These debris are selectively lost in the next arc ignition.
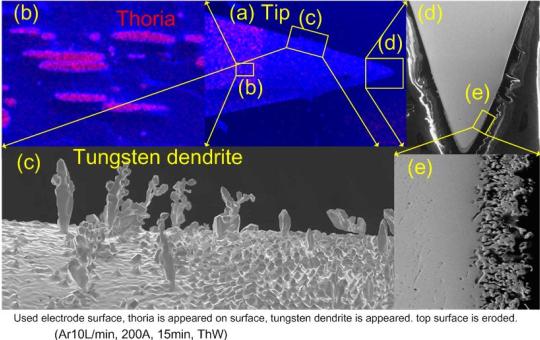
Above picture is summarized picture of this section. This picture shows that the cathode is how damaged by arc. And why incredible cleaning action occurs in the next arc ignition time.
next pageÅ@Å@Å@2016.10.9open,Å@2016.10.10revised