How to analyze high-speed video of arc igniton behavior
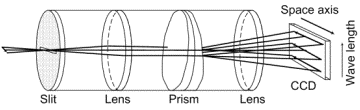 Spectrum analysis is very important to understand arc welding process. There is a very convenient prism called "Imspector" to attach between a camera and a lens. Right figure shows its principle and actual out looking. A line image is developed to two-dimensional image which include axis information and spectrum information as described in the figure. Right picture shows how to use at actual capturing process. Watching area for arc welding is very small, so extension tube is usually used for observation. The Imspector is inserted between camera and extension tube.
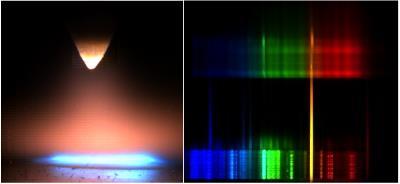
Right picture is an example of captured image of arc and spectrum. There are some types by capable wavelength range. Spectrum image to show this section is normal visible wavelength. I used to use normal monochrome camera to capture spectrum. But it is difficult to explain the effect of color. So, I used color camera to capture spectrum. Captured image is easy to understand the spectrum behavior.
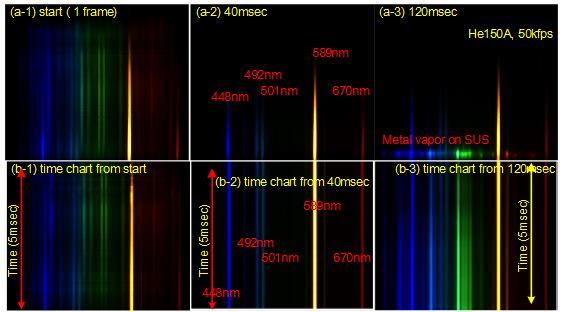
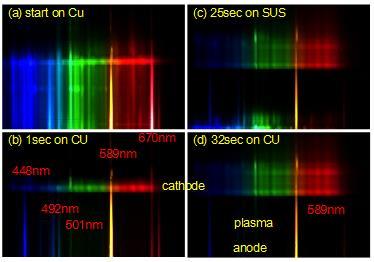
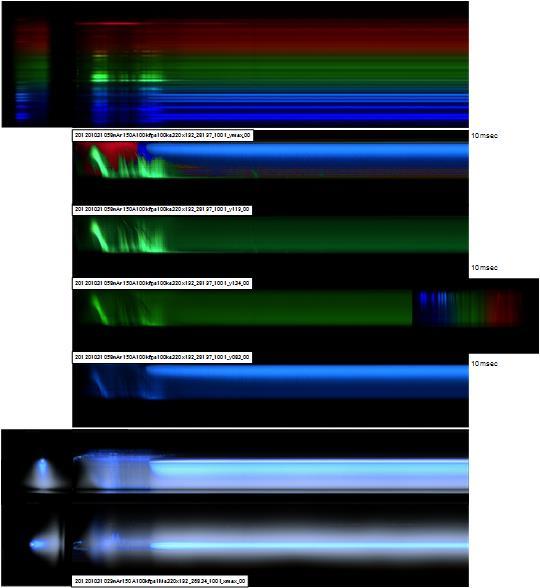
Below pictures show the results of experiment. Left top image (a-1) is a spectrum image at ignition moment. Shielding gas is helium and video rate is 50kfps. Middle top image (a-2) is a spectrum at 40msec later from the arcignition. Right top image (a-3) is one st 120msec later. Middle top image (a-2) is a spectrum at 40msec later from the arc ignition. Right top image (a-3) is one at 120msec later. Images of near bottom is a surface of base metal. Just above the mid line is the top to the cathode. A color high-speed camera was used to capture spectrum information to avoid misunderstanding of wavelength. Bottom images are time chart of spectrum during 5 msec. Time flows from topside to bottom side. Duration of first 5 msec is a period of transient stage as describe former section. Spectra from metal vapor are essential in this transient period. The base metal is not so hot to evaporate metal vapor.
When time pasts about 120msec from the arc ignition, the base metal being melted, and some amount of metal are evaporated to the plasma region as shown in image(b-3). Now, we can consider actual transient behavior of arc to watch image information and spectrum information. However, these two kinds of video were not captured simultaneously.
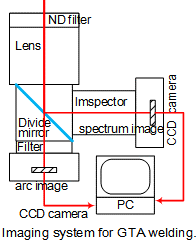
I used to capture arc image and spectrum image at the same time by using a special optical divider as shown in a right figure. Used cameras were small enough to attach the divider. But video rate was at most 250fps at that time. It was not enough to understand transient behavior. Ultra high-speed video camera system was too large to attach the optical divider. I had captured arc image and spectrum image by different two high-speed cameras, simultaneously. But, it was too difficult to do experiment by myself. I had no colleague to do this kind of experiments. So, the results were insufficient to open.
Right pictures show typical spectrum behavior for helium shield. An arc struck on an active flux coated water cooled copper anode. The spectrum profile shows the materials of the active flux and helium. Original video rate and image size are 1kfps and 512x512 pixels, respectively. Original movie take too long time to watch. The movie to watch is changed to 200fps equivalent. It takes about 1 minute to watch.
The effects of metal vapor on cathode behavior should be considered carefully. Considering spectrum behavior on the cathode is important to understand. I had taken various situations to understand what is happening on the cathode during welding. But, I haven't had clear answer at this moment. We can think about qualitative difference from these videos. Quantitative analysis can be carried out by using of these digital data. However, sensitivity of the sensor and transparency efficiencies of use lens and filters are much influenced their wavelength. So, it is very difficult to carry correct quantitative analysis. The following figures show only the difference of time for each wavelength data. Comparing the actual difference among different wavelength is another problem.
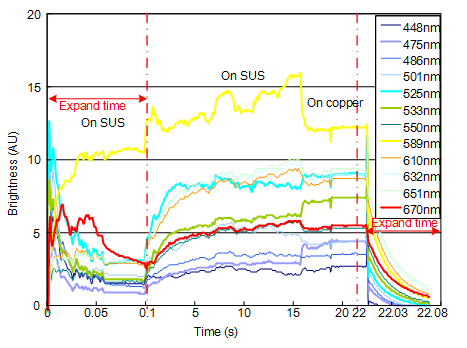
Right figure shows time difference of spectrum behavior. The figure shows the behavior from arc initiation to the expiration. Time constants of temperature for each region are quite different as described before. So, the time scales on transient states and steady state are different. Time scales for first 100msec and expiration period are expanded to understand the behaviors. An upper figure shows time charts of brightness for each typical wavelength.
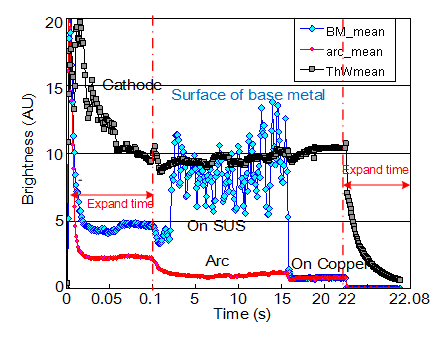
Right figure shows total brightness in each specific region such as surface of weld pool, cathode and arc plasma region. Cathode region has the highest brightness at ignition stage. Arc at actual transient state has also high brightness, but it is decrease to the lowest soon. When the base metal is melted, light from vapor becomes large, but it is fluctuated much. When the arc reaches on the water cooled copper, metal vapor expires, and the brightness becomes low. At the expiration period, the brightness on cathode region decreases slowly with its time constant, because of its heat capacity has some value.
Spectrum distributions between it on Stainless steel and it on the water cooled copper are different. Changes of each wavelength in three different region such as cathode, arc and surface metal are sown in below figure.
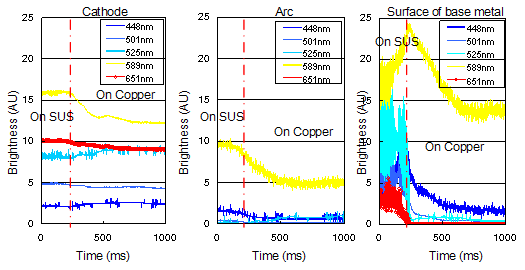
Difference on the cathode is not so typical, because metal vapor influence is not so strong on cathode. Some wavelengths relating metal vapor are slightly decreased. Wavelength relating to shield gas is slightly increased. Tendency is the same in arc region. The behavior on the surface of weld pool is different compared to former two cases. Wavelengths of 501, 525 and 651nm are decreased drastically. However, wavelengths of 448 and 589nm show different pattern. When arc is reaching to the border between stainless still and water cooled copper, brightness of both wavelengths are slightly increased. And when arc reaches to the water cooled copper region, they are slowly decreased.
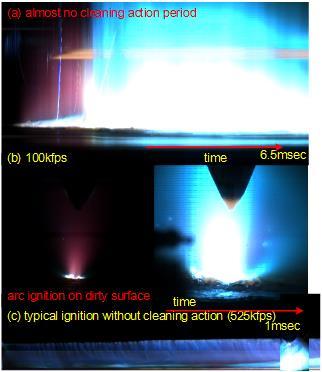
Right pictures are examples of little cleaning actions. Cleaning action occurs by strong high frequency generator when the arc channel between the cathode and the anode is too weak. When the enough ions and electrons are generated from the anode area, current channel between the cathode and the anode becomes enough tight. Break down on the cathode surface by the frequency generator will remarkably decreased. However, there is a possibility, weak breakdown on the cathode surface are existed. Brightness during main arc time are so strong to recognize weak breakdown features. I feel that I had better to check the weak brightness change on the cathode in near future.
| spct_20111228nHe100A20kfps, effect of active flux | |||
|---|---|---|---|
 |
 |
 |
 |
| nHe2kfps | nHe20kfps | aHe2kfps | aHe20kfps |
| spct_20111228Ar100A20kfps, effect of active flux | |||
|---|---|---|---|
 |
 |
 |
 |
| nAr2kfps | nAr20kfps | aAr2kfps | aAr20kfps |
| He shield (100kfps(top)/5kfps(bottom) | |||
|---|---|---|---|
 |
 |
 |
 |
 |
 |
 |
 |
| n100A | a100A | n150A | a150A |
| Ar shield (100kfps(top)/5kfps(bottom) | |||
 |
 |
 |
 |
 |
 |
 |
 |
| n100A | a100A | n150A | a150A |
Next pictures are one of the concluding remarks for high-speed video analysis. Using high-speed video is very effective for transient behavior of arc ignition stage. Especially, using spectrum observation and arc image observation are effective to consider actual process.
next pageÅ@Å@Å@2016.10.9open,Å@2016.10.10revised