How to analyze high-speed video of arc igniton behavior
 The gathered information image like in right picture is one solution to summarize arc ignition stage. This image impressed spattering and unusual plume explosion.
This processed image gives us a good understanding of what was happening in the short duration of arc ignition stage. However, much information was neglected to summarize a whole series of arc ignition stage in only one picture. It is not so difficult to show video on internet.
| Example of arc ignition behavior as in below picture | ||
|---|---|---|
 |
 |
 |
| color 250fps | color 30fps | 694nm 30fps |
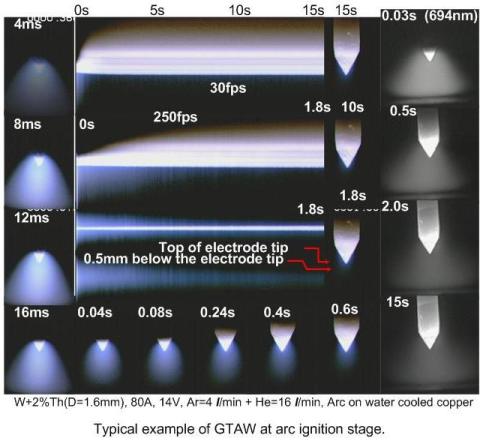
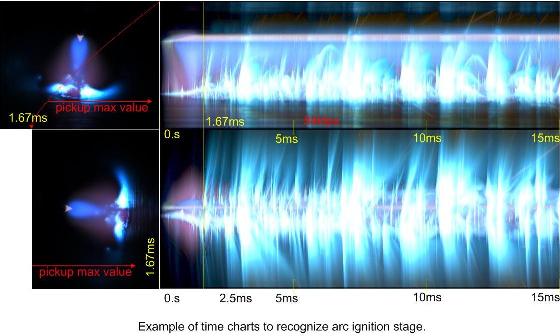
One is an ordinal method to show continuous pictures in time series. Another is showing time chart like an optical flow on horizontal and vertical axes. Latter method is easy to understand the behavior on time series. This hybrid showing system aids quick understanding of captured high-speed video information at a glance. And it is good way to save memory size. It was very expensive to keep big data in a storage. Data transfer rate from high-speed video to PC or PC to external storage. PC and storage system become very high quality and economical prices. However, quality and price of high-speed video also improved remarkably. A below picture is one example of high-speed video at 54kfps. It became clear that former high-speed video could not capture the actual ignition stage of arc. The cleaning action of cathode can be captured by high-speed video rate more than 10kfps. Transient state continues almost 10 seconds in the above picture. And, rapid change continues less than 5 seconds. Observing this main transient process is able to use video rate of 250fps. But, this video rate of 250fps is insufficient to observe just after the arc ignition. The most important behavior occurs in first 10 m-seconds as shown in below. A video rate more than 10kfps is required to understand arc ignition behavior, in this meaning. Many particles sputtered from the cathode and the base metal in 4 m-seconds. An arc in the below pictured was ignited on active flux coated metal, then plume from the base metal is strong.
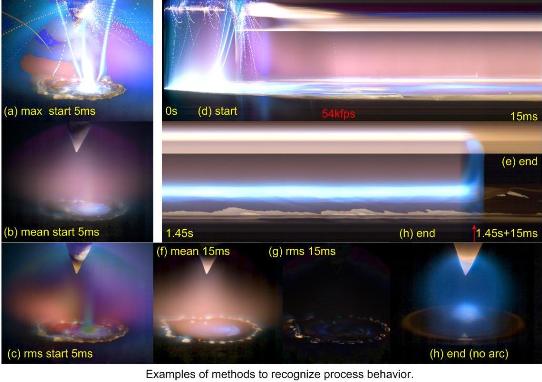
Image (a) in above picture shows the maximum brightness during first 5 m-seconds. This image indicates physical characteristics of spattering. Image (b) shows averaged behavior in first 5 m-seconds. Blue area in image (a) is particular area of transient state. Because, red color in image (a) is almost the same as image (b). Image (c) shows variation during the same start duration. Spattering occurs only a short duration, so there is only a few influence in variation. Deviations of arc plasma and plume from the molten pool are rather strong influences.
Time charts in start and end durations show behaviors of 15 m-seconds. First 5 m-seconds of high-speed images include 270 frames. Spattering is once a 270 frames, so, the influence on variation is neglected. Last 15 m-seconds of high-speed video contains 810 frames. Image (f) is a mean image of last 810 frames.
An active flux makes deepen penetration in GATW of SUS304. The flux contains titanium, and I think titanium works as special catalysis for ionization and reduction. Heat capacity of coated material is very low compared to the base metal. This is another reason why strong plume emitted from the base metal. A transient state continued about 8mili-seconds in this case. But, true stable condition of the cathode need about 3 second as described above.
The above picture contains time chart of arc expiring. The power machine has special characteristic ability to keep small current for arc expired duration. Very small current flow only a short duration, then some light from redaction of metal ion can be shown in the video. An anode area is stricted in the center of welding pool in rhe case of ATIG process. A typical reduction process of metal vapor can be seen at expiring duration.
Popular researchers deal arc characteristics in steady state for industrial use. I used to think about different points of view like niche field. So, transient states of arc welding has to been very interesting. I have tried to understand about these transient state. But, they are to complex and difficult to understand.
A picture below shows time chart of arc ignition without shielding gas. This is another special condition for cleaning action of the cathode surface. The video rate is also 54kfps in this case. The special point of this video is no cleaning action on the cathode surface. There is no steady state in air arc. Oxidation on the base metal is violently occurred. And the cathode is also eroded by oxidation. A suitable arc channel is quickly formed, then apparent cleaning action on the cathode is expired.
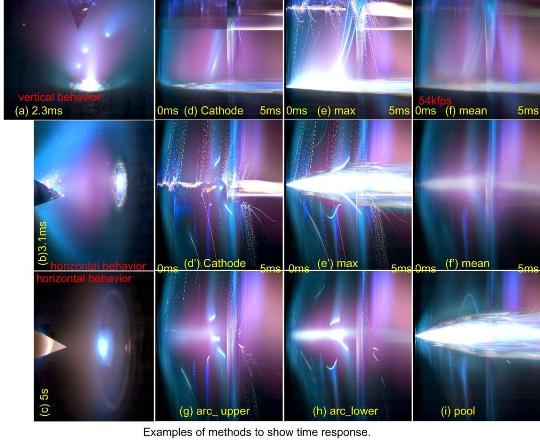
Detail consideration about transient state of arc ignition requires higher video rate. Actual transient behavior finishes very short duration as shown in below picture. Images (a), (b) and (c) indicate maximum brightness (a)during first 2.3ms, (b)at 3.1ms, and (c)at 5 seconds. Three top-right time-charts indicate the arc behavior during first 5 m-seconds. Image (d), (e) and (f) show the brightness time-chart on the cathode center, maximum brightness on horizontal axis, and mean brightness of the same horizontal axis, respectively. Image (d) indicates that there is no cathode spot on the top of the cathode in early ignition period. Cathode spot appears at about 3ms later from the ignition start. At the moment of the cathode spot moves to the top, there exists bright arc region appears below the cathode top. Cathode spot stably remains on the top since this moment.
Image (e) indicates total behavior of arc ignition. Image (f) also indicates total behavior, but it neglects abnormal events like sputtering. We need to consider horizontal time chart and vertical time chart simultaneously. Anode spots usually exist out of cathode axis. Arc is very sensitive and instable, so, I cannot believe normal numerical simulation. Some hypothesis to calculate simulation must have some defects, I think.
Bottom three time charts show behaviors of upper region of arc plasma, lower region of arc plasma and surface of welding pool, respectively. Each regions of GTA welding process has quite different characteristics because of differences of temperature, heat capacity, time constant, including minor elements and so on. Analysis of high-speed video is quite interesting field to pick-up important information. However, some important information are neglected in the analyzing process. It is important, having careful understanding about what kinds of information are lost.
High-speed video rate higher than 100kfps is needed to understand actual cleaning action of the cathode in ignition stage. I had tried to capture the processes by ultra-high speed camera. Some captured video can be watched by clicking this sentence.
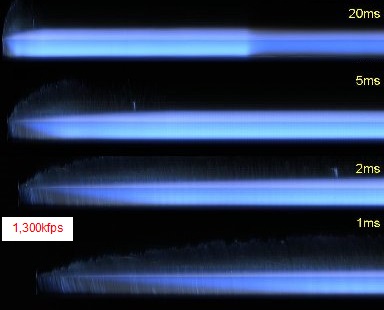
Right picture shows arc ignition behavior take by an ultra-high-speed video, which video rate is 1,300kfps. We have to concentrate the capture size. Area size of ultra-high-speed video is restricted in narrow size. I chose 2 mm wide section on the cathode center to watch the important information at 1,300kfps. In case of 600kfps capturing time, the actual width enlarged to 4mm, which contain whole cathode region. However, cleaning action on the cathode can be recognized by this time charts.
Making time chart of high-speed video is not so easy. Appeared picture of time-charts are quite different on points of view to watch. The easier way is to pick-up maximum value on each axis for one frame. But in case of high variation videos like above picture, Some important information on the cathode is easy to disappeared. Detailed explanations how to make time-charts are described on a section in Japanese.
The following pictures are typical examples of time-charts for various welding conditions. Explanations for each time-charts are also in Japanese section.
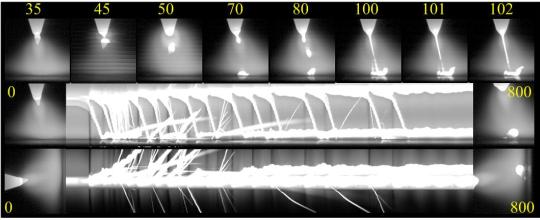
Typical pattern of arc ignition for pure tungsten electrode is drawn in below. The work function of the pure tungsten is not good enough to produce arc current in solid state. Then top area of the cathode was melted with arc ignition and dropped on the anode.
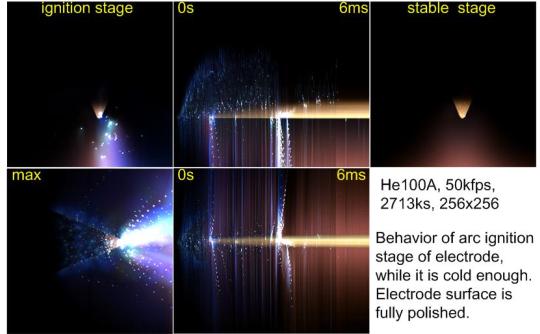
A few per cents of thoria is added into the tungsten electrode to improve arc emitting ability. The thoriated cathode works as solid cathode as shown below. However, cleaning action exists in first 5 m-sec of arc ignition. The cathode is grinded and polished just before the arc ignition. Some particles are sputtered from the top and side region.
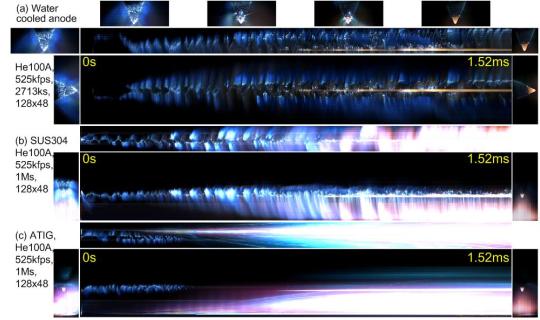
Effects of anode material on arc ignition in helium shield are drawn in below. Arc were ignited on (a)water cooled copper, (b)normal SUS304 and (c)active flux painted SUS304 from top to bottom. Evaporation of anode material is neglected for the water cooled copper anode. Then cleaning action on the cathode surface continue longer. The top point of the cathode becomes blight at about 0.8msec.
Duration of cleaning action becomes shorter in the case of arc on SUS304. Cleaning action occurs more clear in this case, and arc plasma appears from the top of the cathode to the base metal. The top point of the cathode becomes blight at about 0.8msec.
In the case of flux coated, which is called ATIG process is quite different. A cleaning action occurs for the beginning of about 0.4msec. Arc plasma region generates from the anode surface. Arc initiation looks like very smooth. However, the top point of the cathode becomes blight at about 0.8msec. Heat capacity of the cathodes are the same, then temperature behavior of the cathode maybe the same for three different anode conditions.
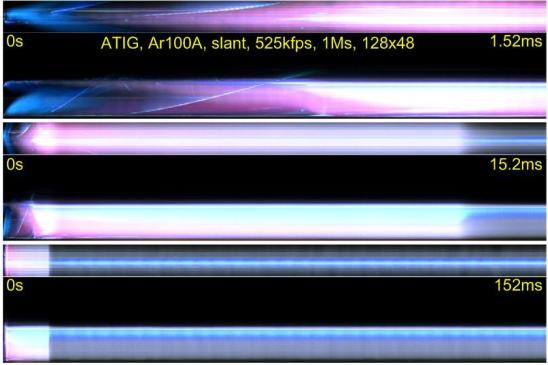
ATIG effect in argon shield is drawn in below. Time duration of the charts are 1.52msec, 15.2msec and 152msec from top to bottom. Upper chart is vertical chart, and lower is a horizontal chart, respectively. Behavior is slightly different from the helium shield. A short duration of cleaning action is the same, but plasma behavior in first 1msec is different. The cathode top brightness behavior is the same as it in helium shield. A high frequency power generator works about 13msec, then the brightness of arc plasma is much high in this period.
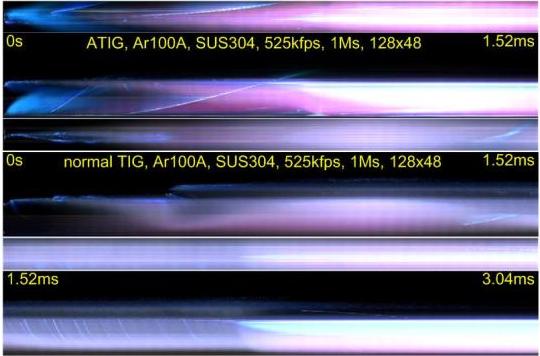
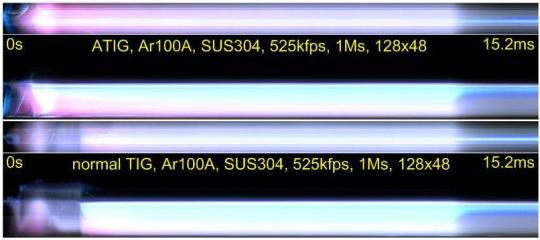
The difference of ATIG and normal TIG in argon shield is drawn below. Cleaning action is quite weak compared to helium shield, but still exists. Plasma from the base metal is essential for ATIG case. Plasma from the base metal merely appeared in normal TIG case. There is some minor change of plasma behavior on the base metal in above picture during 15.2msec for ATIG case. So, following time chart during 1.52 to 3.04msec of normal TIG case is added at the bottom of the picture. This picture suggests that the cathode spot is concentrated at the moment of about 2.2msec for the normal TIG case.
Effects of active flux on arc ignition in argon shield is summarized below. The arc ignition behaviors in 1msec are quite different by flux. The behaviors are different form 1 to 2.2msec, but tendency looks like the same. After that, behaviors look almost the same.
next pageÅ@Å@Å@2016.10.9open,Å@2016.10.10revised